Canada Revenue Agency Quarterly Financial Report For the quarter ended September 30, 2023
Disclaimer
We do not guarantee the accuracy of this copy of the CRA website.
Scraped Page Content
Canada Revenue Agency Quarterly Financial Report For the quarter ended September 30, 2023
Statement outlining results, risks and significant changes in operations, personnel and program
Introduction
This quarterly financial report has been prepared by management as required by section 65.1 of the Financial Administration Act in the form and manner prescribed by the Treasury Board. This report should be read in conjunction with the Main Estimates.
Further details on the Canada Revenue Agency’s (CRA) program activities can be found in the Departmental Plan.
Basis of Presentation
This quarterly report has been prepared by management using an expenditure basis of accounting. The accompanying Statement of Authorities includes the CRA's spending authorities granted by Parliament and those used by the CRA consistent with the Main Estimates for the 2023-2024 fiscal year. This quarterly report has been prepared using a special purpose financial reporting framework designed to meet financial information needs with respect to the use of spending authorities.
The authority of Parliament is required before moneys can be spent by the government. Approvals are given in the form of annually approved limits through appropriation acts or through legislation of statutory spending authority for specific purposes.
The CRA uses the full accrual method of accounting to prepare and present its annual departmental financial statements that are part of the departmental performance reporting process. However, the spending authorities voted by Parliament remain on an expenditure basis.
This quarterly report has not been subject to an external audit or review.
Highlights of the fiscal year-to-date (YTD) results
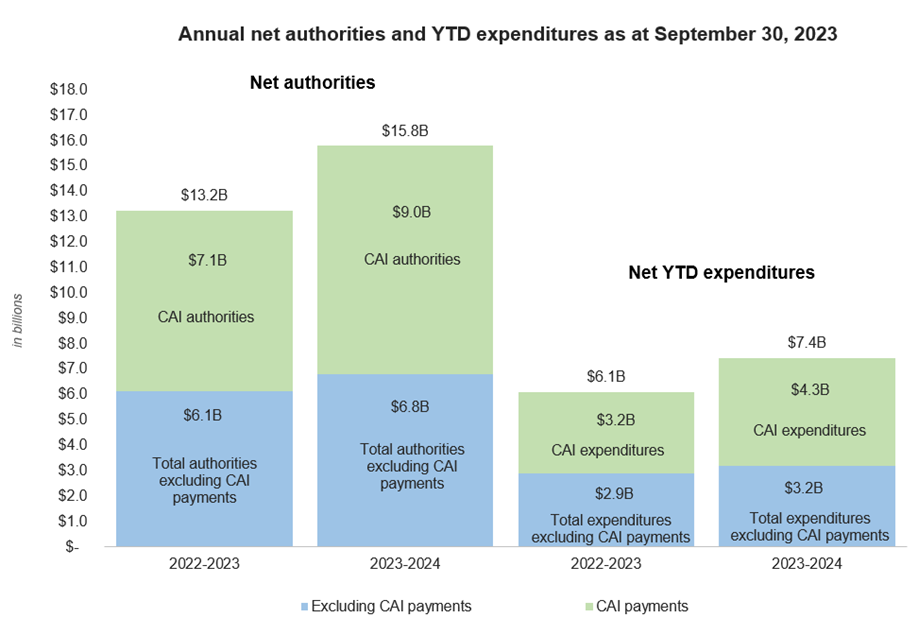
Figure 1 below reflects the CRA's annual net authorities available for use, as well as the CRA’s YTD expenditures as at September 30, 2023.
The CRA’s annual net authorities and YTD expenditures have increased primarily due to the Climate Action Incentive (CAI). Further analysis of authorities and expenditures are below.

This financial table compares the Agency’s total available authorities available as of September 30, expenditures used during the quarter and year-to-date expenditures for fiscal years 2023-2024 and 2022-2023 by voted authority. This table uses parentheses to show negative numbers.
Figure 1 – details
| Authority/Expenditure | Year | Total authorities excluding CAI payments |
CAI payments | Total |
|---|---|---|---|---|
|
Authorities |
2022-2023 |
$ 6.1 |
$ 7.1 |
$ 13.2 |
|
2023-2024 |
$ 6.8 |
$ 9.0 |
$ 15.8 |
|
|
Expenditures |
2022-2023 |
$ 2.9 |
$ 3.2 |
$ 6.1 |
|
2023-2024 |
$ 3.2 |
$ 4.3 |
$ 7.4 |
Note: The authorities and expenditures excluding CAI payments includes all Vote 1, Vote 5 and statutory authorities and expenditures excluding those related to the CAI.
Year-over-year (YOY) analysis of authorities
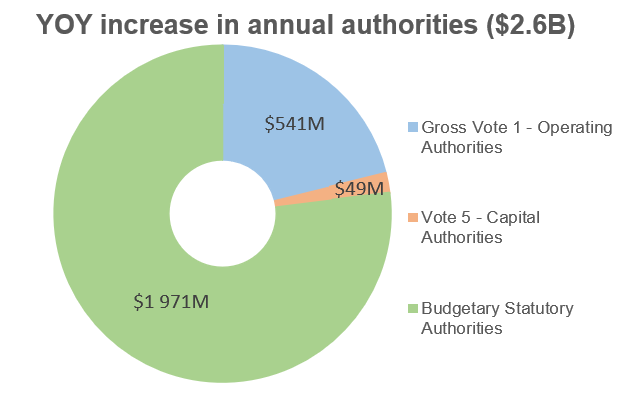
This report reflects the results for the current fiscal year in relation to the Main Estimates and authorities available for use from the prior fiscal year. As shown in the summarized table below, the CRA’s total Budgetary Authorities have increased by $2,560M ($2.6B) since the second quarter of 2022-2023, from $13,229M ($13.2B) in 2022-2023, to $15,789M ($15.8B) in 2023-2024.

| (in millions of dollars) | Total available for use for the year ending March 31, 2024 | Total available for use for the year ending March 31, 2023 | Variance in budgetary authorities |
|---|---|---|---|
|
Gross Vote 1 – Operating Authorities |
5 713 |
5 171 |
$541M |
|
The increase in Gross Vote 1 Operating Authorities is primarily related to:
|
|||
|
Revenue Credited to the Vote |
(441) |
(441) |
- |
|
Vote 5 – Capital Authorities |
158 |
109 |
$49M |
|
The increase in Vote 5 Capital Authorities is related to:
|
|||
|
Budgetary Statutory Authorities |
10 360 |
8 389 |
$1 971M |
|
The increase in Budgetary Statutory Authorities is primarily related to:
|
|||
|
Total Budgetary Authorities |
15 789 |
13 229 |
$2 560M ($2.6B) |
This table is an extract of Appendix 1 of this report. Columns and rows may not add exactly due to rounding.
YOY analysis of expenditures
Expenditures by vote
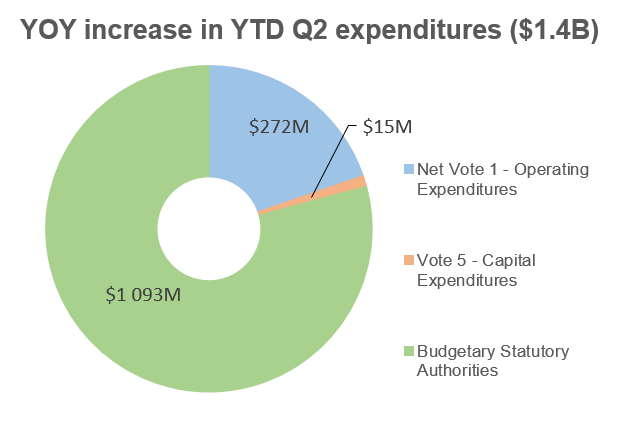
The second quarter expenditures as at September 30, 2023 have increased by $1,380M ($1.4B), as displayed in the Statement of Authorities. The material components of this YOY change are explained below.Footnote 1

| (in millions of dollars) | YTD expenditures at September 30, 2023 | YTD expenditures at September 30, 2022 | Variance in YTD expenditures |
|---|---|---|---|
|
Net Vote 1 – Operating Expenditures |
2 477 |
2 204 |
$272M |
|
The increase in Net Vote 1 Operating Expenditures is primarily related to:
|
|||
|
Vote 5 – Capital Expenditures |
42 |
27 |
$15M |
|
Budgetary Statutory Authorities |
4 948 |
3 855 |
$1 093M |
|
The majority of the increase in Budgetary Statutory Authorities is related to:
|
|||
|
Total Budgetary Authorities |
7 467 |
6 086 |
$1 380M ($1.4B) |
This table is an extract of Appendix 1 of this report. Columns and rows may not add exactly due to rounding.
Expenditures by standard object
As mentioned previously, the material variancesFootnote 2 will be explained in the table below. The transfer payments standard object makes up the majority of the YOY variance in YTD expenditures with the other standard objects making up only a small portion.

| (in millions of dollars) | YTD expenditures at September 30, 2023 | YTD expenditures at September 30, 2022 | Variance in YTD expenditures |
|---|---|---|---|
|
Transfer Payments |
4 476 |
3 389 |
$1 087M |
|
The increase in Transfer Payments, is primarily related to:
|
|||
|
Personnel |
2 668 |
2 428 |
$240M |
|
The variance explanation noted in the Net Vote 1 section is also applicable to the Personnel standard object, in addition to increases in other items, including EBP. |
|||
|
Professional and Special Services |
271 |
231 |
$39M |
|
The increase in Professional and Special Services is primarily related to internal expenditures paid to other Government of Canada departments, including:
|
|||
|
Other Standard Objects |
273 |
260 |
$13M |
|
The increase in the remaining standard objects are primarily related to:
|
|||
|
Revenue Credited to the Vote |
(221) |
(222) |
$1M |
|
Total Budgetary Authorities |
7 467 |
6 086 |
$1 380M ($1.4B) |
- Transfer payments include the Children’s Special Allowance payments, CAI payments and the Distribution of Fuel and Excess Emission charges.
- This table is an extract of Appendix 2 of this report. Columns and rows may not add exactly due to rounding.
Risks and uncertainties
The CRA strives to be a world-class tax and benefits administration that is trusted, fair, and helpful. As such, the CRA dedicates significant effort to conduct regular environmental scans and update its Corporate Risk Profile (CRP), as the economic and technological landscape changes. The Board of Management monitors, and CRA senior management receives, quarterly updates on the CRP. The CRA’s key risks and mitigation strategies are outlined in the 2023-2024 Departmental Plan.
Current financial management risks present at the CRA include the spending reductions announced in Budget 2023. This series of reductions, starting in 2023 2024, aims to support the government initiative to refocus government spending. Given the CRA’s solid financial position, the required reduction in the current year of $12 million for travel and professional services expenditures will be absorbed without impacting workplan targets. These expenditures are being closely monitored to ensure the CRA is compliant with this requirement. A plan for the refocusing of government spending has been developed to address future reductions in 2024-2025 and ongoing and has been submitted to the Treasury Board Secretariat. The CRA continuously and cautiously monitors its authority levels and expenditures throughout the year, conducts accurate and reliable forecasting of its operational spending, and has significant controls in place to ensure effective financial management is achieved.
Furthermore, the CRA recognizes that all of the key risks identified in the Departmental Plan could have financial impacts should they materialize. In particular, the CRA is managing risks related to the strategic priority of strengthening security and safeguarding privacy. In this regard, the Agency Security Officer (ASO) plays an important role in promoting “Security by Design”, which includes strengthening the CRA’s overarching posture for cybersecurity, fraud risk management, and data protection. In order to keep pace with a continuously evolving threat landscape, the CRA proactively anticipates and implements measures to reduce and address potential risks and respond swiftly to incidents and events.
The CRA’s Chief Privacy Officer (CPO) continues to strengthen the CRA’s Privacy Management Framework. The CPO plays a pivotal role in promoting Privacy by Design, including assessing the privacy impacts of the CRA’s programs, managing privacy breaches, and championing personal privacy rights. The CPO, in collaboration with the ASO and the Chief Financial Officer, ensures that Canadians' personal information is appropriately safeguarded and managed. Trust in the safeguarding of private information is vital to Canadians’ participation in the tax and benefits system.
Significant changes in relation to operations, personnel, and programs
A significant change this fiscal year includes the signing of the new PSAC collective agreement. The current year’s financial impacts are identified in the YOY analysis of expenditures section, as authorities for the new agreement have not yet been formally received. In addition, the new Professional Institute of the Public Service of Canada collective agreement is awaiting ratification, and salary increases for executives were recently approved by the Government of Canada. These additional agreements will have financial impacts later on in the current fiscal year and on an ongoing basis.
Approval by Senior Officials
Approved by:
[original signed by]
________________________
Bob Hamilton, Commissioner
[original signed by]
_____________________________
Hugo Pagé, Chief Financial Officer
Ottawa, Canada
Date:
| Total available for use for the year ending March 31, 2024table 4 note 3 | Used during the quarter ended September 30, 2023 |
Year-to-date used at quarter-end | |
|---|---|---|---|
|
Vote 1 - Operating expenditures |
|||
|
Gross Operating expenditures |
5 713 |
1 478 |
2 697 |
|
Revenues netted against expenditures |
(441) |
(110) |
(220) |
|
Net Vote 1 - Operating expenditures |
5 272 |
1 368 |
2 477 |
|
Vote 5 - Capital expenditures |
158 |
27 |
42 |
|
Budgetary Statutory Authorities |
|||
|
Contributions to employee benefit plans |
586 |
146 |
293 |
|
Children's Special Allowance payments (Children's Special Allowances Act) |
368 |
98 |
191 |
|
Climate Action Incentive payments |
8 999 |
2 213 |
4 263 |
|
Spending of revenues received through the conduct of its operations pursuant to section 60 of the Canada Revenue Agency Act |
358 |
86 |
167 |
|
Distribution of Fuel and Excess Emission Charges |
49 |
13 |
22 |
|
Minister's salary and motor car allowance |
0 |
0 |
0 |
|
Collection Agency Fees under section 17.1 of the Financial Administration Act |
- |
0 |
- |
|
Court awards - Supreme Court |
- |
- |
- |
|
Court awards - Tax Court of Canada |
- |
12 |
12 |
|
Spending proceeds from the disposal of surplus Crown Assets |
- |
0 |
0 |
|
Energy Cost Benefit |
- |
0 |
(0) |
|
Refunds of previous years revenue |
- |
0 |
0 |
|
Total Budgetary Statutory Authorities |
10 360 |
2 568 |
4 948 |
|
Total Budgetary Authorities |
15 789 |
3 963 |
7 467 |
This financial table compares the Agency’s total available authorities available as of September 30, expenditures used during the quarter and year-to-date expenditures for fiscal years 2023-2024 and 2022-2023 by voted authority. This table uses parentheses to show negative numbers.
| Total available for use for the year ending March 31, 2023table 5 note 3 | Used during the quarter ended September 30, 2022 |
Year-to-date used at quarter-end | |
|---|---|---|---|
|
Vote 1 - Operating expenditures |
|||
|
Gross Operating expenditures |
5 171 |
1 218 |
2 426 |
|
Revenues netted against expenditures |
(441) |
(111) |
(222) |
|
Net Vote 1 - Operating expenditures |
4 731 |
1 107 |
2 204 |
|
Vote 5 - Capital expenditures |
109 |
18 |
27 |
|
Budgetary Statutory Authorities |
|||
|
Contributions to employee benefit plans |
532 |
133 |
266 |
|
Children's Special Allowance payments (Children's Special Allowances Act) |
365 |
93 |
183 |
|
Climate Action Incentive payments |
7 088 |
3 073 |
3 188 |
|
Spending of revenues received through the conduct of its operations pursuant to section 60 of the Canada Revenue Agency Act |
385 |
120 |
198 |
|
Distribution of Fuel and Excess Emission Charges |
19 |
9 |
18 |
|
Minister's salary and motor car allowance |
0 |
0 |
0 |
|
Collection Agency Fees under section 17.1 of the Financial Administration Act |
- |
(0) |
- |
|
Court awards - Supreme Court |
- |
0 |
0 |
|
Court awards - Tax Court of Canada |
- |
1 |
2 |
|
Spending proceeds from the disposal of surplus Crown Assets |
- |
0 |
0 |
|
Energy Cost Benefit |
- |
(0) |
(0) |
|
Refunds of previous years revenue |
- |
0 |
0 |
|
Total Budgetary Statutory Authorities |
8 389 |
3 428 |
3 855 |
|
Total Budgetary Authorities |
13 229 |
4 554 |
6 086 |
This financial table compares the Agency’s total available authorities available as of September 30, expenditures used during the quarter and year-to-date expenditures for fiscal years 2023-2024 and 2022-2023 by voted authority. This table uses parentheses to show negative numbers.
| Planned expenditures for the year ending March 31, 2024 | Expended during the quarter ended September 30, 2023 | Year-to-date used at quarter-end | |
|---|---|---|---|
|
Expenditures: |
|||
|
Personnel |
4 764 |
1 421 |
2 668 |
|
Transportation and communications |
306 |
25 |
56 |
|
Information |
53 |
4 |
8 |
|
Professional and special services |
1 137 |
191 |
271 |
|
Rentals |
338 |
78 |
150 |
|
Purchased repair and maintenance |
81 |
14 |
26 |
|
Utilities, materials, and supplies |
52 |
3 |
6 |
|
Acquisition of machinery and equipment |
77 |
4 |
9 |
|
Transfer payments |
9 421 |
2 324 |
4 476 |
|
Other subsidies and payments |
0 |
9 |
17 |
|
Total Gross Budgetary Expenditures |
16 230 |
4 073 |
7 687 |
|
Less: Revenues netted against expenditures |
441 |
110 |
220 |
|
Total Net Budgetary Expenditures |
15 789 |
3 963 |
7 467 |
This financial table compares the Agency’s planned expenditures available as of September 30, expenditures used during the quarter and year-to-date expenditures for fiscal years 2023-2024 and 2022-2023 by standard object. This table uses parentheses to show negative numbers.
| Planned expenditures for the year ending March 31, 2023 | Expended during the quarter ended September 30, 2022 | Year-to-date used at quarter-end | |
|---|---|---|---|
|
Expenditures: |
|||
|
Personnel |
4 476 |
1 211 |
2 428 |
|
Transportation and communications |
264 |
24 |
45 |
|
Information |
47 |
2 |
7 |
|
Professional and special services |
905 |
151 |
231 |
|
Rentals |
321 |
60 |
144 |
|
Purchased repair and maintenance |
85 |
29 |
29 |
|
Utilities, materials, and supplies |
44 |
2 |
5 |
|
Acquisition of machinery and equipment |
58 |
8 |
24 |
|
Transfer payments |
7 477 |
3 175 |
3 389 |
|
Other subsidies and payments |
0 |
3 |
5 |
|
Total Gross Budgetary Expenditures |
13 669 |
4 665 |
6 308 |
|
Less: Revenues netted against expenditures |
441 |
111 |
222 |
|
Total Net Budgetary Expenditures |
13 229 |
4 554 |
6 086 |
This financial table compares the Agency’s planned expenditures available as of September 30, expenditures used during the quarter and year-to-date expenditures for fiscal years 2023-2024 and 2022-2023 by standard object. This table uses parentheses to show negative numbers.
- Footnote 1
-
Material expenditures are defined as being greater than 0.5% of total current year expenditures, $37 million. This materiality level aligns with the directive on accounting standards: GC 1010 financial statement concepts (materiality).
- Footnote 2
-
Material expenditures are defined as being greater than 0.5% of total current year expenditures, $37 million.
- Footnote 3
-
Includes only authorities available for use and granted by Parliament at quarter-end.
Page details
2023-11-29
